
Worked exampleExported from Calvance
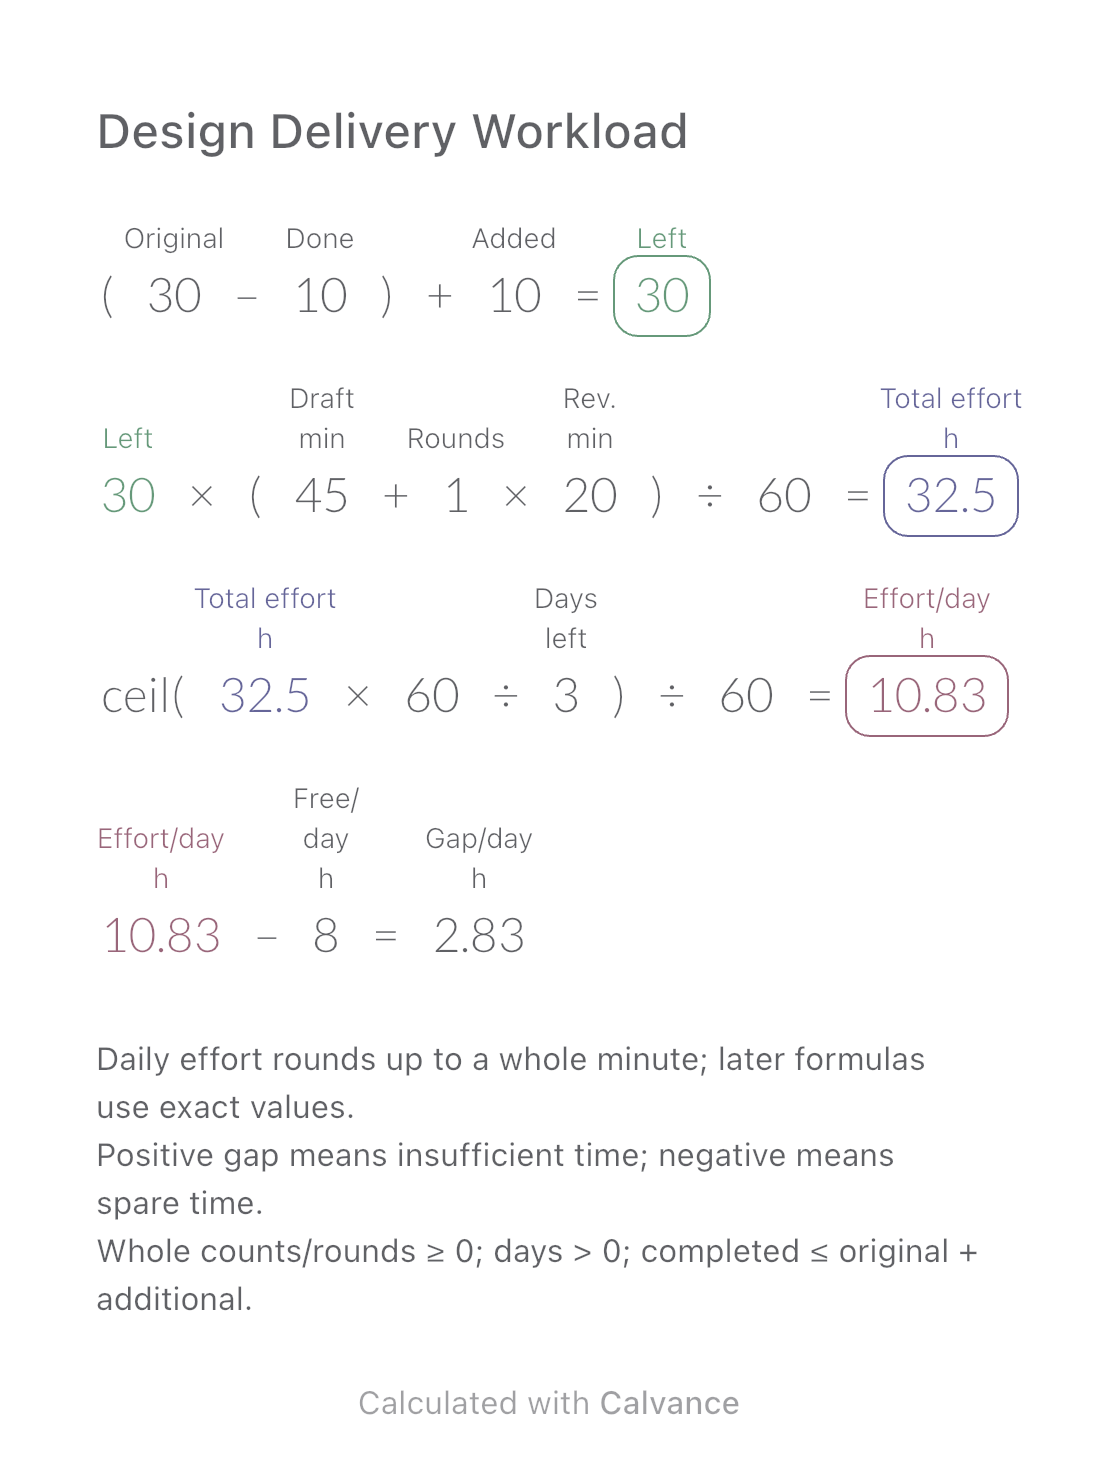
Design Delivery Workload
Estimate remaining design hours, daily effort and the gap against your available time when image quantities or revisions change.
View template and methodEstimate runtime for two average loads and compare deliverable energy with a target operating period.
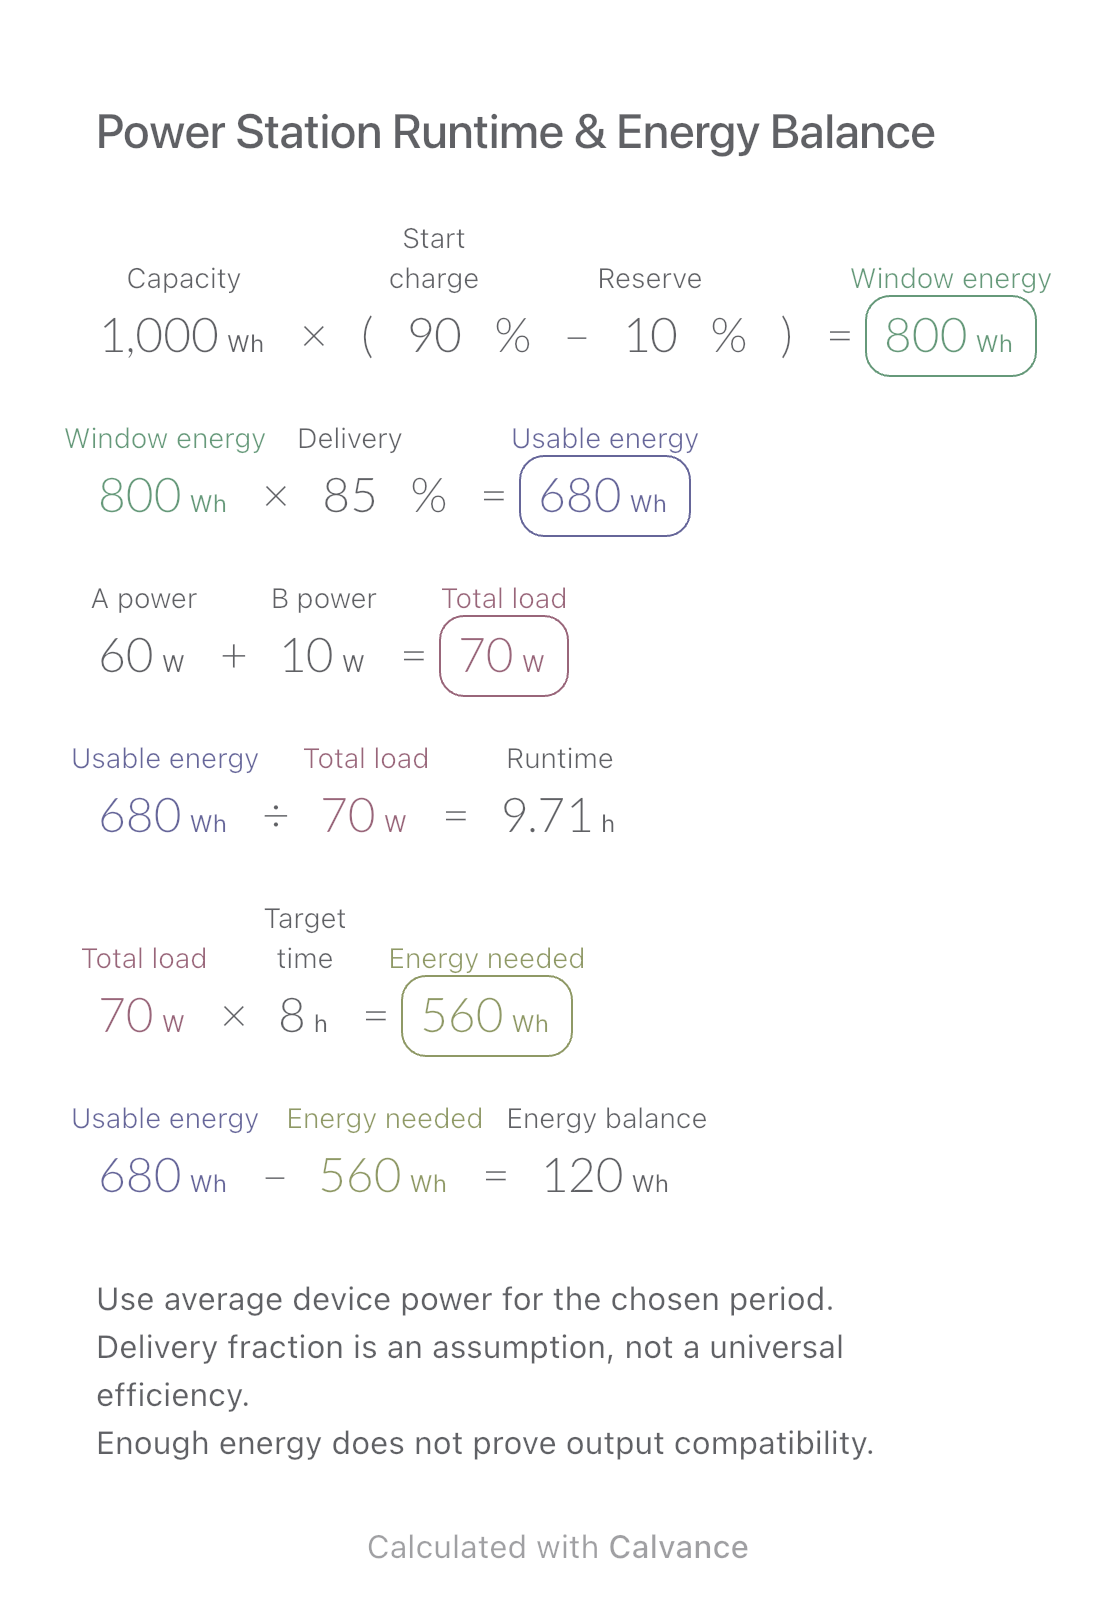
Exported by the iOS App After importing, edit the numbers in Calvance.
For two device loads sharing one time window, such as an outdoor work or camping plan. Enter rated Wh, starting and reserve charge, and an effective delivery fraction appropriate to your equipment and conditions. The example percentage is a chosen assumption, not a specification for every power station.
| Inputs | Default |
|---|---|
| Rated battery energy (Wh) | 1,000 |
| Starting charge relative to rated energy (%) | 90 |
| Charge to keep at the end (%) | 10 |
| Effective delivery fraction under the chosen conditions (%) | 85 |
| Device A average power (W) | 60 |
| Device B average power (W) | 10 |
| Target time for both loads (h) | 8 |
Charge-window energy = rated Wh × (starting charge − reserve charge). Multiply it by the chosen delivery fraction, add the two average loads, and divide deliverable Wh by total W for hours. At 1000 Wh, 90% start and 10% reserve, the window holds 800 Wh. A chosen 85% delivery fraction gives 680 Wh. Loads of 60 W and 10 W give 68/7 hours. Eight hours needs 560 Wh, leaving 120 Wh.
1,000 [Rated battery energy Wh] × (90 [Starting charge relative to rated energy]%-10 [Charge to keep at the end]%) → Energy in the chosen charge window Wh
Energy in the chosen charge window Wh × 85 [Effective delivery fraction under the chosen conditions]% → Estimated energy deliverable to devices Wh
60 [Device A average power W] + 10 [Device B average power W] → Combined average device load W
Estimated energy deliverable to devices Wh/Combined average device load W → Estimated runtime for that load h
Combined average device load W × 8 [Target time for both loads h] → Energy needed for the target time Wh
Estimated energy deliverable to devices Wh-Energy needed for the target time Wh → Energy remaining or shortfall Wh
Change only device A from 60 W to 100 W. Combined load becomes 110 W, runtime becomes 68/11 hours, and eight hours needs 880 Wh. The energy balance changes from 120 Wh spare to a 200 Wh shortfall.
| Result | Default | Changed |
|---|---|---|
| Energy in the chosen charge window (Wh) | 800 | 800 |
| Estimated energy deliverable to devices (Wh) | 680 | 680 |
| Combined average device load (W) | 70 | 110 |
| Estimated runtime for that load (h) | 9.71 | 6.18 |
| Energy needed for the target time (Wh) | 560 | 880 |
| Energy remaining or shortfall (Wh) | 120 | -200 |
Results are displayed to at most two decimal places; later formulas use unrounded values.
Rated energy and target time must be positive. Require 0 ≤ reserve < start ≤ 100%, 0 < delivery ≤ 100%, nonnegative individual loads and positive total load. The delivery fraction is a simplified aggregate assumption; it is not a fixed planning margin. Do not deduct the same loss twice. Cycling loads, temperature, self-consumption and battery condition can change actual runtime. Check ports, continuous output and startup surge separately. No Ah/mAh conversion, charging, solar forecast or critical-power guarantee is included.
Energy and output are separate: EcoFlow.
Download and import into Calvance to edit the numbers. The canvas does not reject every invalid input; check the stated ranges.
No. Stored energy and device consumption determine this estimate; output limits are a separate check.
Use a representative average for the period. Compressor cycling makes continuous nameplate-power assumptions unreliable.
We recommend using the latest version of Calvance.
Estimate remaining design hours, daily effort and the gap against your available time when image quantities or revisions change.
View template and method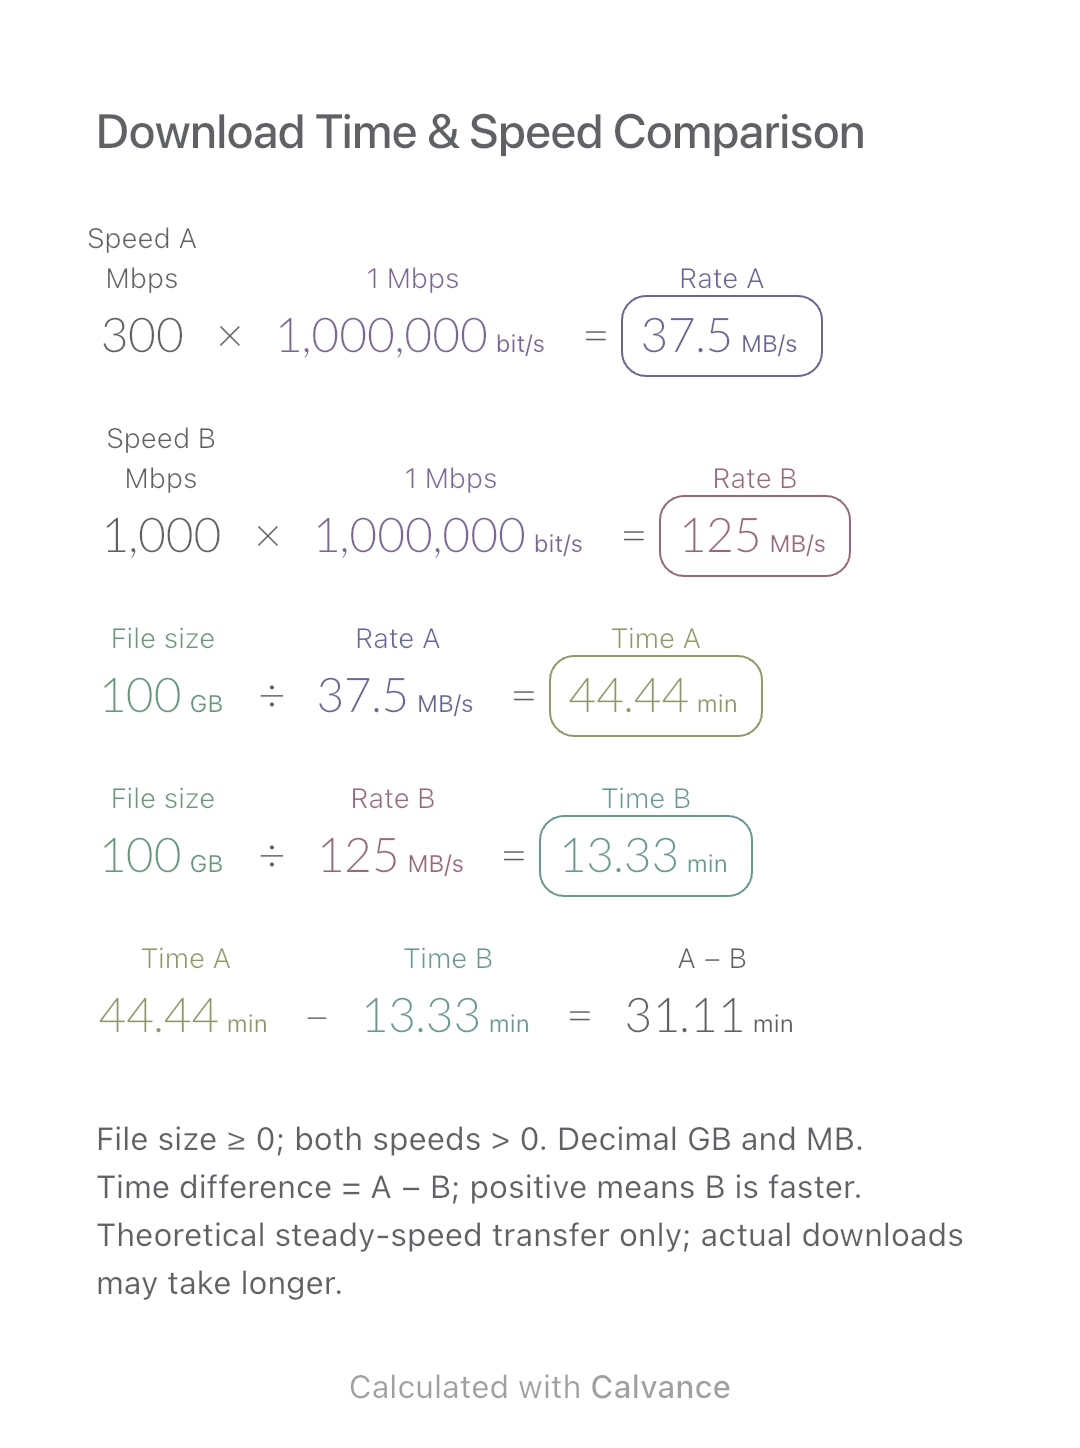
Compare the theoretical download time for one file at two connection speeds. Includes a worked example, Mbps-to-MB/s conversion and an editable Calvance canvas.
View template and method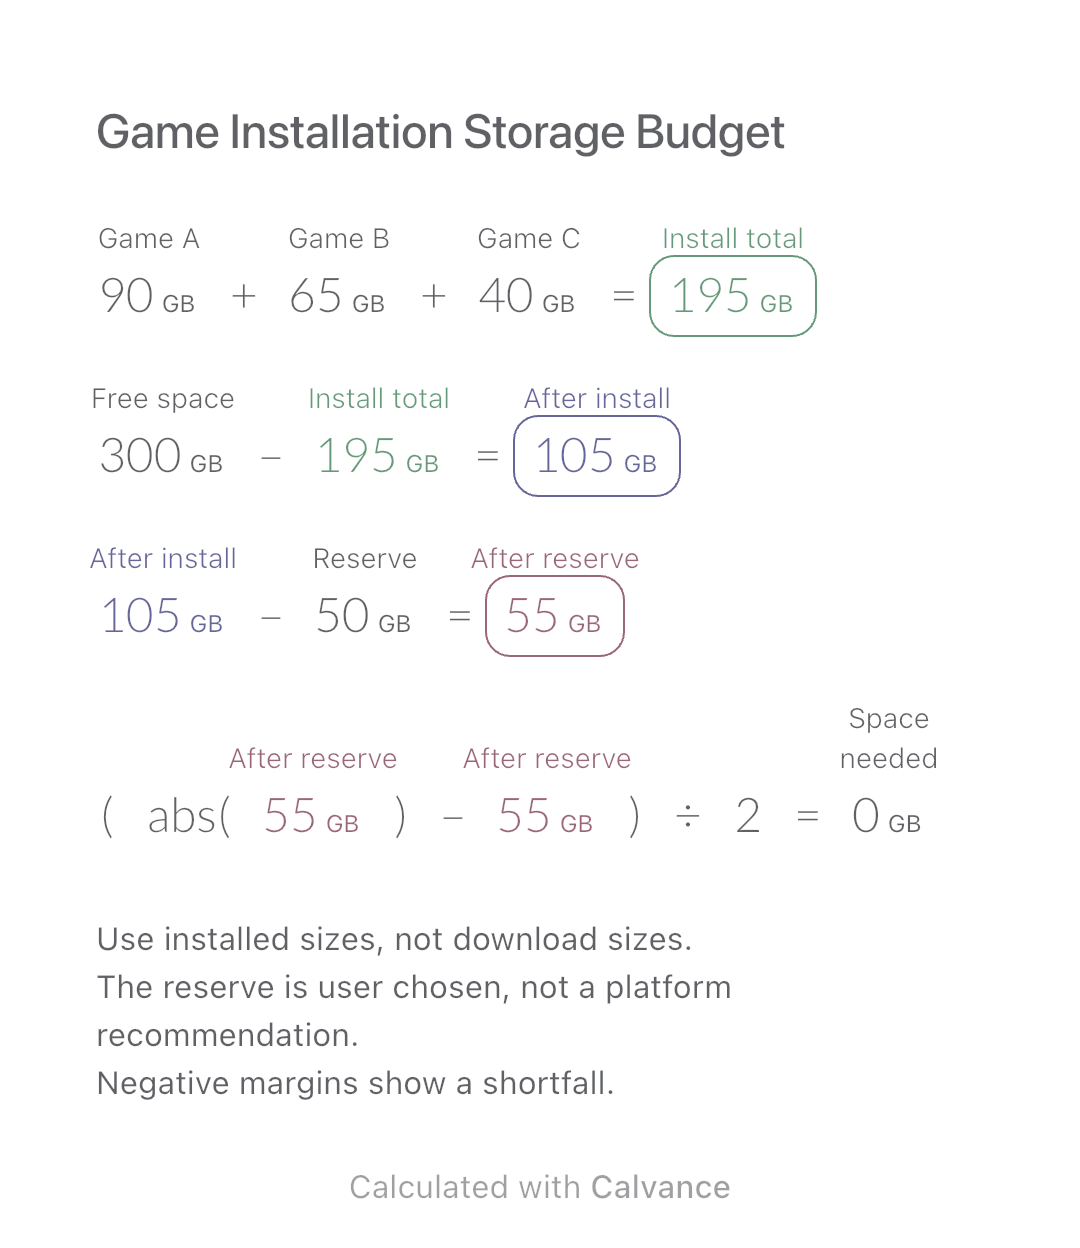
Add three game installation sizes, allow for your chosen reserve and check how much extra space you need before installing.
View template and methodChoose a plan when you need more canvases, high-resolution image exports, or sync across devices.