
Worked exampleExported from Calvance
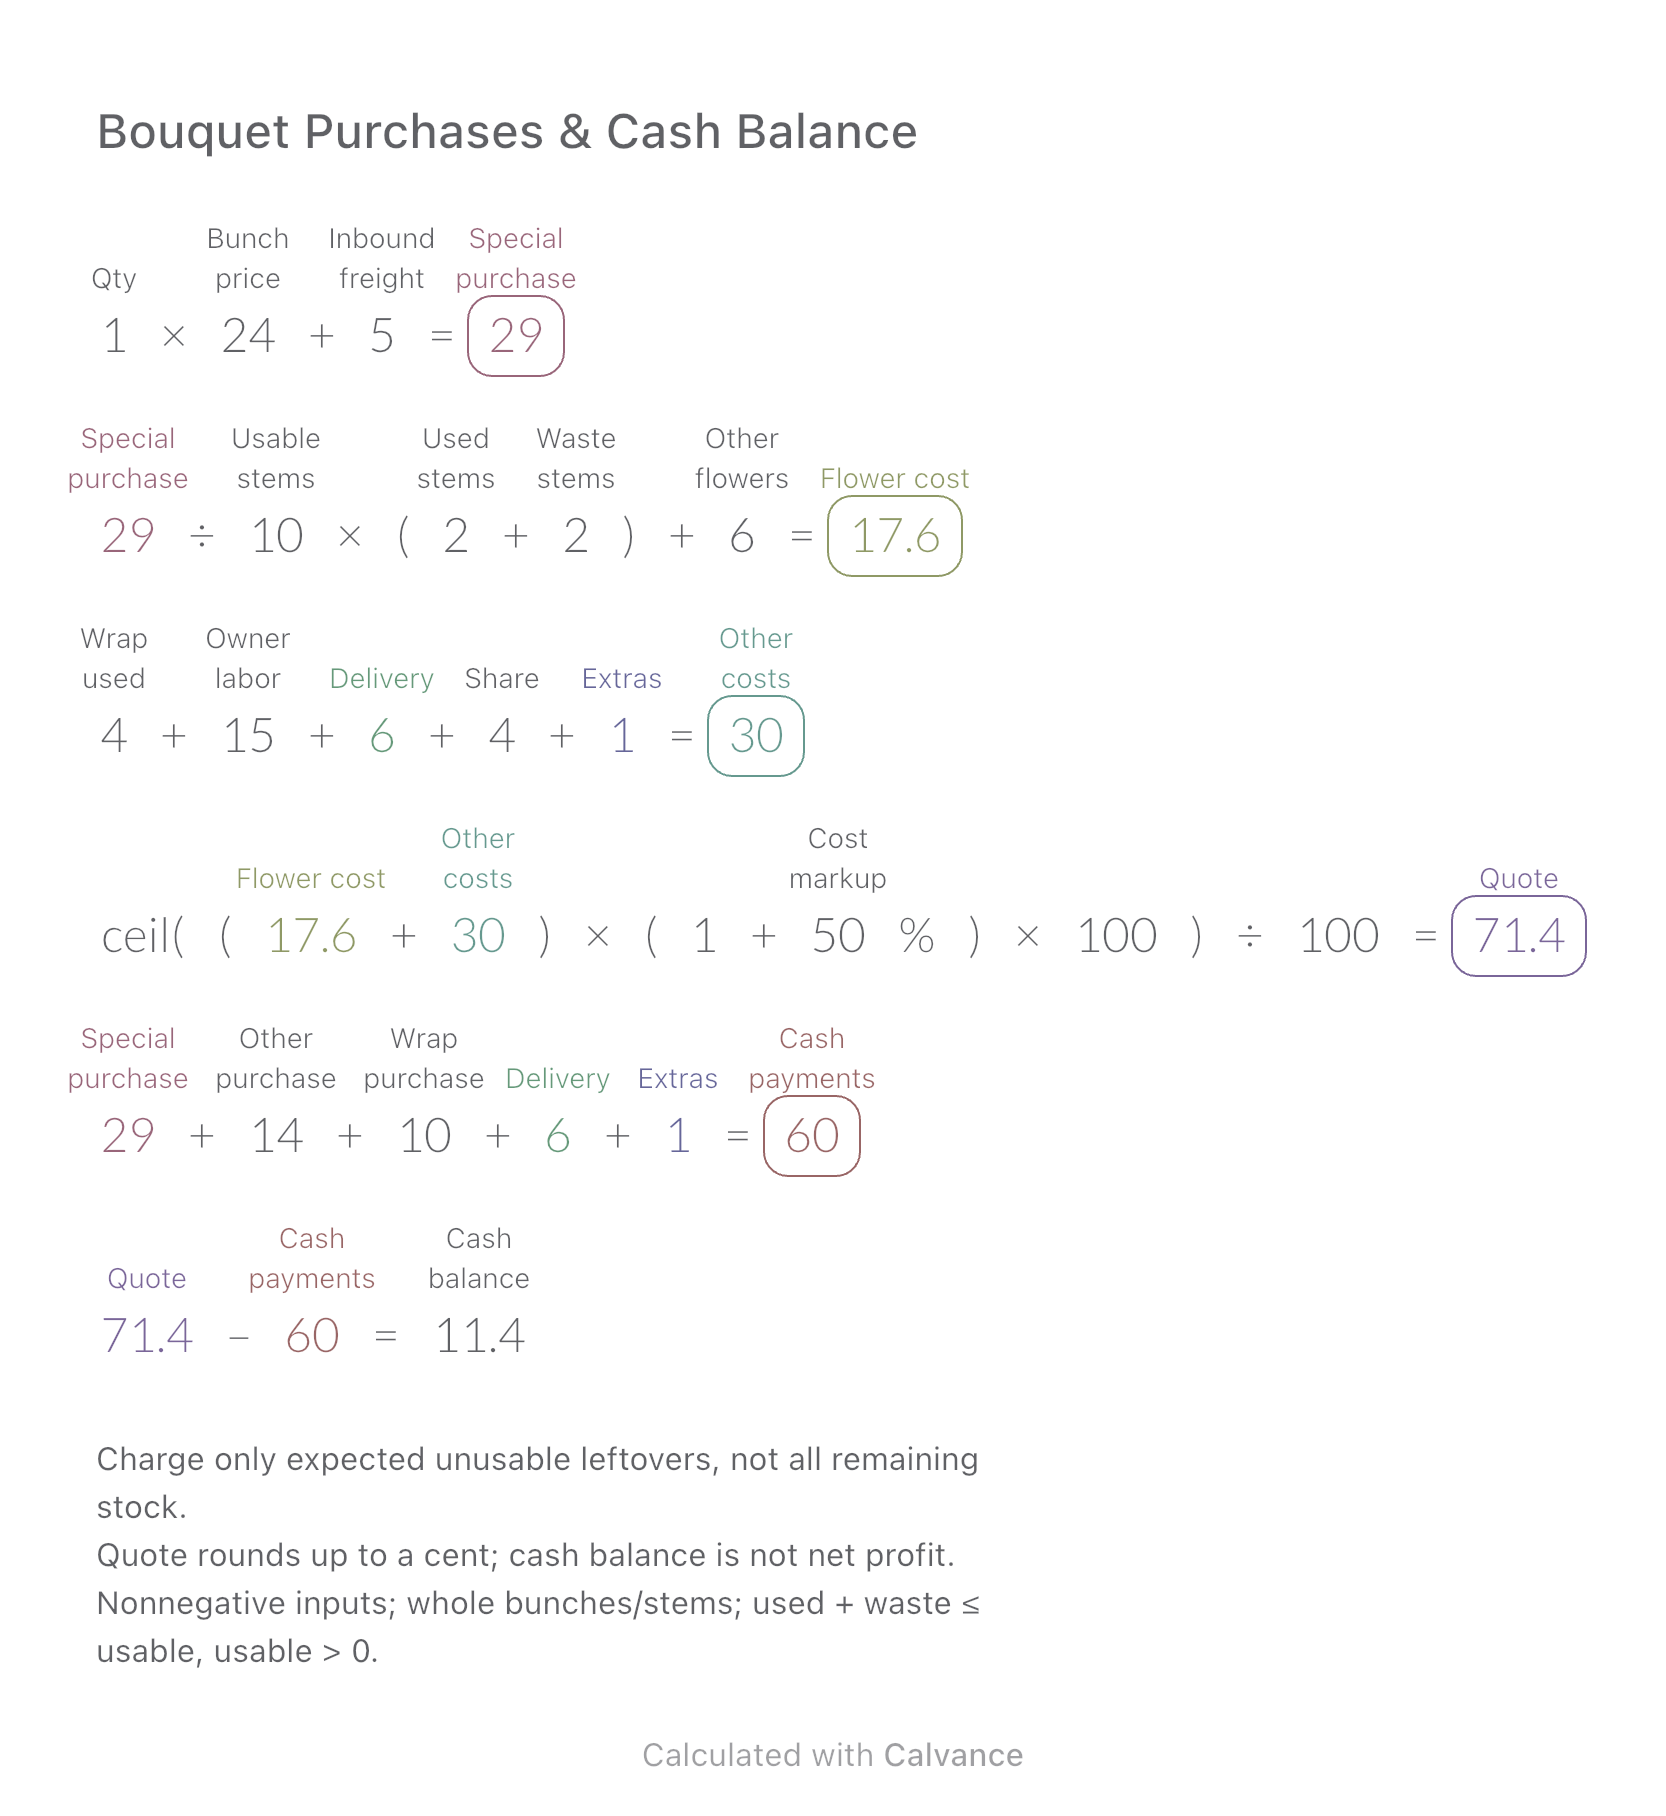
Bouquet Purchases & Cash Balance
Compare the cost of flowers used in one bouquet with the cash needed to buy whole bunches and packaging.
View template and methodCalculate attributed revenue per advertising dollar and the gap to your own ROAS target. Includes a worked example, scope checks and an editable canvas.
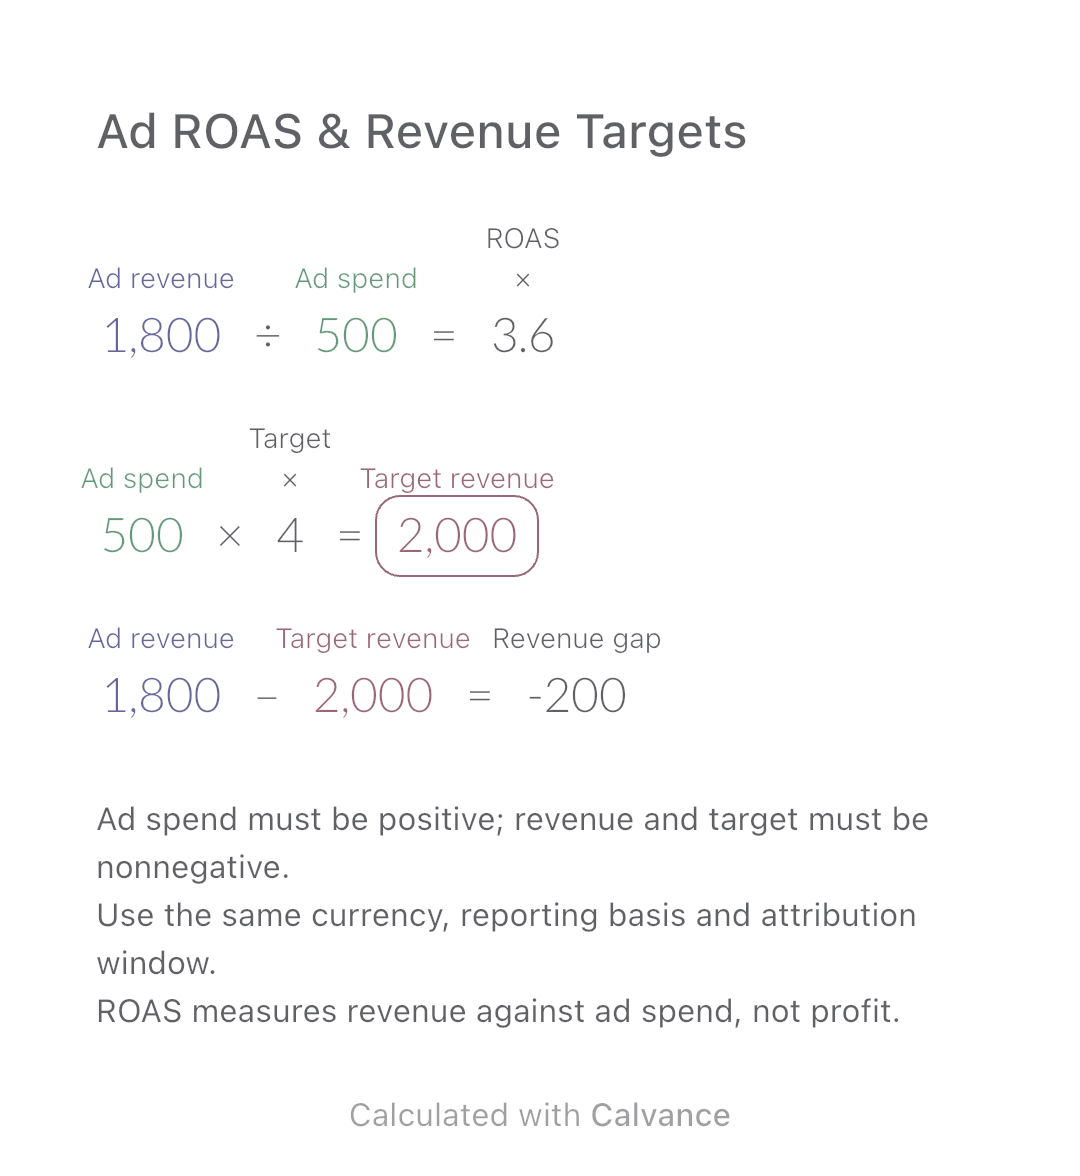
Exported by the iOS App After importing, edit the numbers in Calvance.
For advertisers with ad spend and attributed sales revenue measured on the same basis. This simulated USD example checks a report against a self-chosen target; it does not predict incremental sales or recommend a bidding strategy.
USD
| Inputs | Default |
|---|---|
| Advertising spend | 500 |
| Attributed sales revenue | 1,800 |
| Target ROAS multiple (×) | 4 |
ROAS = attributed sales revenue ÷ ad spend. Target revenue = ad spend × target multiple. Revenue gap = attributed revenue − target revenue; a negative gap is a shortfall. $1,800 revenue on $500 spend is 3.6×. A 4× target requires $2,000, leaving a $200 shortfall. Enter 4 for four times, not 400.
1,800 [Attributed sales revenue]/500 [Advertising spend] → Actual ROAS multiple ×
Advertising spend × 4 [Target ROAS multiple ×] → Revenue needed for target
Attributed sales revenue - Revenue needed for target → Attributed revenue minus target
Change spend from $500 to $600 while holding attributed revenue at $1,800. ROAS falls to 3× and the shortfall grows to $600. This isolates a cost change; it does not predict how actual revenue responds to a larger budget.
| Result | Default | Changed |
|---|---|---|
| Actual ROAS multiple (×) | 3.6 | 3 |
| Revenue needed for target | 2,000 | 2,400 |
| Attributed revenue minus target | -200 | -600 |
Results are displayed to at most two decimal places; later formulas use unrounded values.
Use attributed sales revenue with a defined treatment of refunds, discounts and taxes. Do not mix total store sales or lifetime customer value with unrelated current-period spend, or add overlapping platform attributions. A platform’s conversion value may be a custom score rather than revenue. The 4× example is not an industry benchmark, and attributed revenue does not prove causal lift.
Download and import into Calvance to edit the numbers. The canvas does not reject every invalid input; check the stated ranges.
No. Product costs, fulfilment, fees and overheads remain unpaid. Revenue minus advertising is not net profit, and ROAS minus one is not a complete business ROI.
400% and 4× express the same ratio. This canvas uses multiples. Zero revenue gives zero ROAS; zero spend makes the ratio undefined.
Google Ads explains the ROAS ratio. This example restricts conversion value to attributed sales revenue.
If you earn money by displaying ads on your own site, use website ad revenue instead.
Compare the cost of flowers used in one bouquet with the cash needed to buy whole bunches and packaging.
View template and method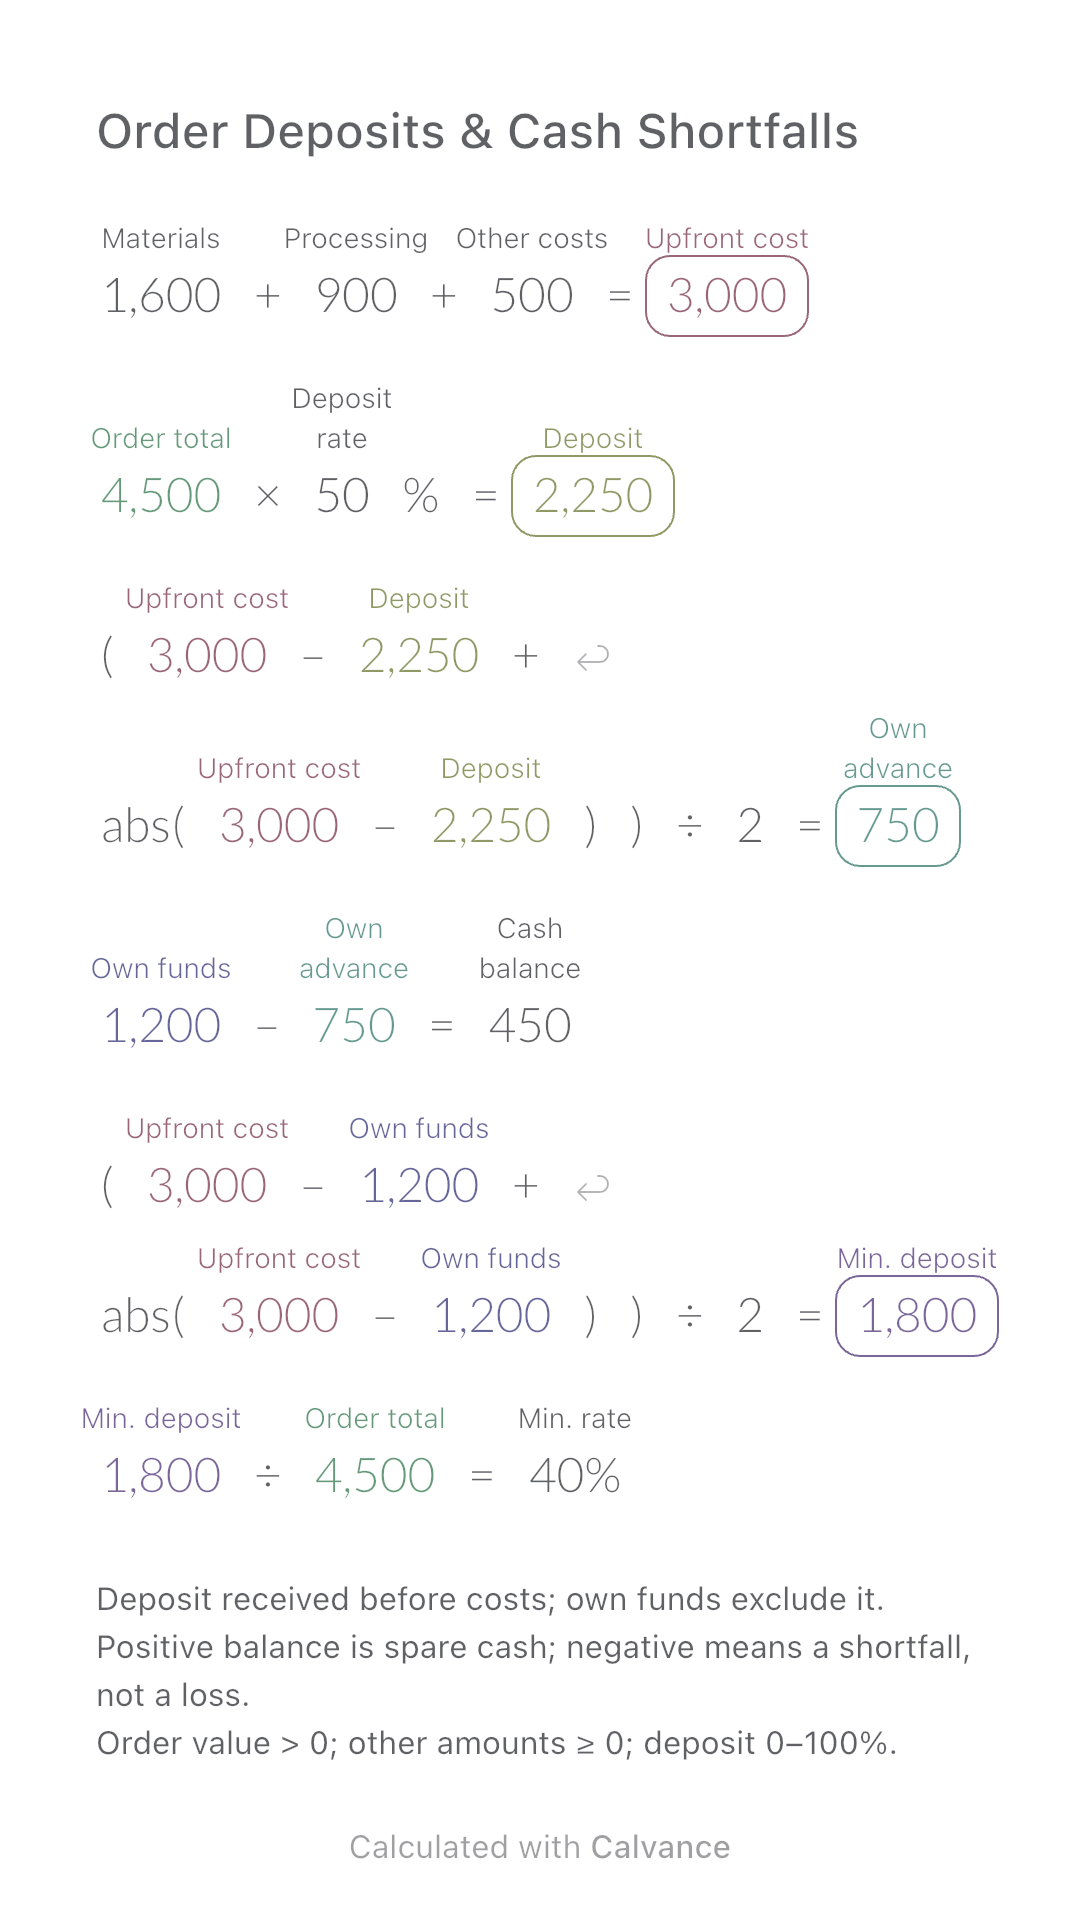
Calculate how much of an order you must fund yourself and the minimum customer deposit needed before production.
View template and method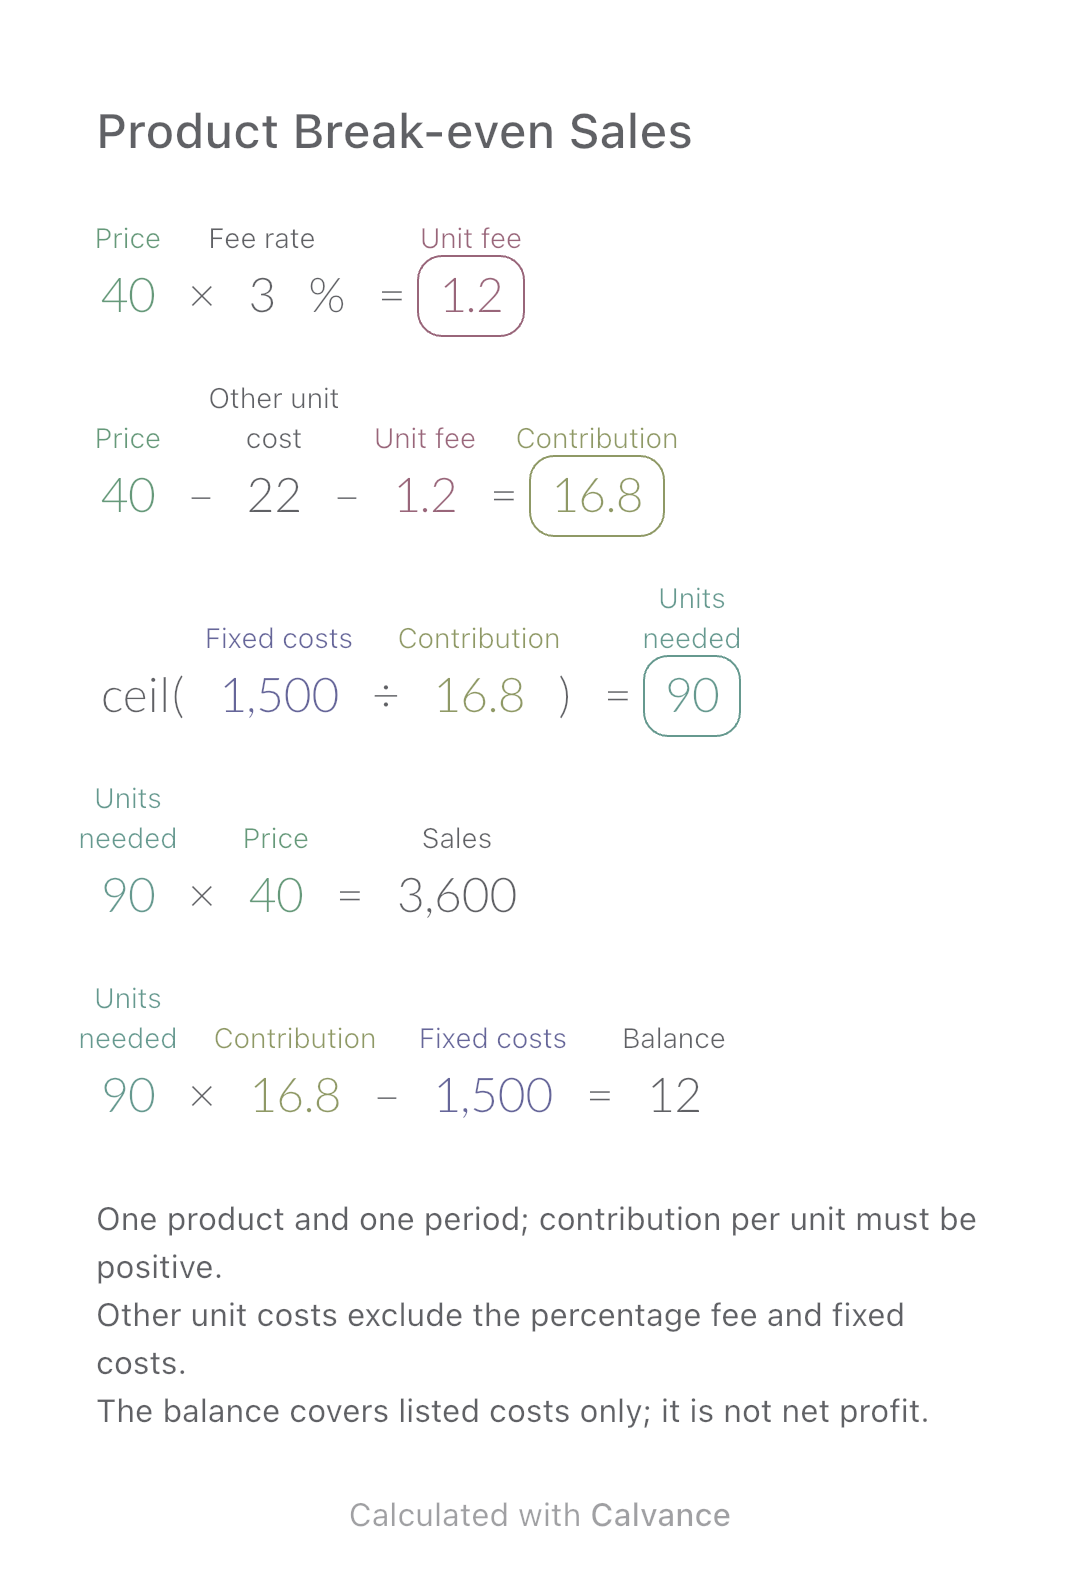
Calculate whole-unit break-even sales including a fee based on selling price. See how a price cut changes contribution, required units and the remaining balance.
View template and methodChoose a plan when you need more canvases, high-resolution image exports, or sync across devices.